Analysis of health and economic consequences of storm events in the United States
Blog
A report produced as an assignment for the Reproducible Research course run by Johns Hopkins University on Coursera

Courtesy John Towner
In this report we aim to show which types of storm events are most harmful to population health, and which have the greatest economic consequences.
The analysis uses a storm database from the United States National Oceanic and Atmospheric Administration (NOAA) containing data for the United States from 1950 to 2011, and focuses on fatalities, property damage, and crop damage caused by storm types.
The conclusion is that across the United States tornadoes are most harmful to population health (causing most deaths) while floods and droughts have the greatest economic consequences (causing the most damage to property and crops), but there is great variation among the states. The report was produced as an assignment for the Reproducible Research course run by Johns Hopkins University on Coursera.
Data processing
First we load the R packages that we use to analyse the data. We use readr for reading the source CSV, dplyr for manipulating the data, and ggplot2 for plotting charts, while knitr and tools are loaded for the kable and toTitleCase functions respectively.
Next we parse the source data. If it hasn’t been downloaded already, we retrieve the source file, decompress it, and convert the resulting CSV file to a data frame. Most columns are skipped and only those of interest are included. The dates are converted from characters to a POSIXct vector and the event type is normalised to title case.
# Download the source file and unzip it, but only if it
# doesn't already exist in the working directory.
if (!) {
}
# Load useful columns, convert dates to POSIXct vectors,
# make event_type column uppercase.
storms <- %>%
The most complex part of the data processing is parsing the columns containing costs for property and crop damage. Property damage is stored in two columns, one containing a number and another containing a multiplier. We need to multiply the first by the second to get a dollar amount for the property damage. Crop damage is similarly across two columns.
The problem comes with the two multiplier columns (one for property, one for crops) not being numerical but being one of a messy set of characters — H means ‘multiply by one hundred’, for example. These columns need to be tidied before they can be used as multipliers, and this is where the damage_multiplier function comes in.
# Function to convert a messy damage multiplier column into
# a number that can be used as a mathematical multiplier.
{
if (multiplier %in% ) {
# If the multiplier is empty, 0, or punctuation, assume
# a multiplier of 1.
multiplier <- 1
} else {
multiplier_num <-
if () {
# If the upper-case multiplier is H, K, M, or B, convert
# that into the matching number, as taken from
# documentation described in the class forum at
# https://class.coursera.org/repdata-035/forum/thread?thread_id=51.
multiplier_vector <-
multiplier <- multiplier_vector
} else {
# If the multiplier is a number, use it directly.
multiplier <- multiplier_num
}
}
multiplier
}
# Convert the messy property damage multiplier column and
# add a column, property_damage_abs, that contains a usable
# damage total.
storms <- storms %>%
%>%
# Convert the messy crop damage multiplier column and add a
# column, crop_damage_abs, that contains a usable damage
# total.
storms <- storms %>%
%>%
From that code you can see that property and crop damage are normalised into two new columns, property_damage_multiplier_abs and crop_damage_multiplier_abs.
The results include three plots, each of which is created using its own data structure. These are created below.
- The
fatalities_by_typedata frame contains the sum of all fatalities for each event type, limited to those event types for which there have been at least 100 fatalities. - The
property_damage_by_typedata frame contains the twenty event types that have caused the most damage to property, along with the cost of the damage - The
crop_damage_by_typedata frame contains the twenty event types that have caused the most damage to crops, along with the cost of the damage
# Calculate the number of fatalities according to event
# type.
fatalities_by_type <- storms %>%
%>%
%>%
%>%
%>%
%>%
# Calculate the cost of damage to property according to
# event type.
property_damage_by_type <- storms %>%
%>%
%>%
%>%
%>%
%>%
%>%
# Calculate the cost of damage to crops according to event
# type.
crop_damage_by_type <- storms %>%
%>%
%>%
%>%
%>%
%>%
%>%
Note that the data is not inflation-adjusted. There are also plenty of misspellings and miscategorisations among the event types, but exploratory analysis showed that this doesn’t affect the results.
Results
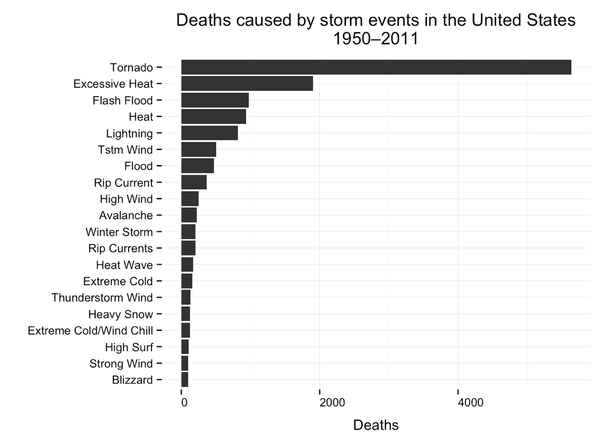
If we first look at fatalities caused by storm events, we see tornadoes are by far the deadliest type of event across the United States. Tornadoes cause 5,633 deaths while the next contender, excessive heat, caused 1,903. The twenty event types that caused the most deaths across the time period are shown in the plot below.
# Plot deaths by event type.
+
+
+
+
+
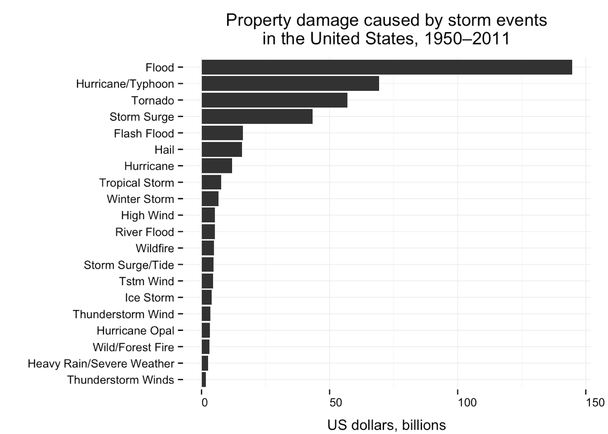
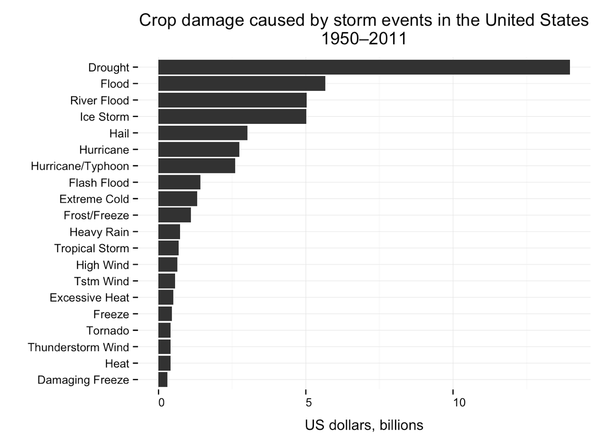
Next we look at the economic consequences of storms. Despite causing most deaths, tornadoes aren’t the biggest cause of damage to property and they cause relatively little damage to crops. Instead, floods are the greatest cause of damage to property while drought is the biggest cause of damage to crops. In the two plots below we can see the twenty event types that cause the greatest damage to property and crops.
# Plot cost of property damage by event type.
+
+
+
+
+
# Plot cost of crop damage by event type.
+
+
+
+
+
These plots show data for the United States as a whole, but the country is famous for its heterogeneity. Below is a table showing the most deadly event type for each state. We can see that although tornadoes cause most fatalities across the United States, it’s localised to the South and the Midwest. In Alaska the biggest killers are avalanches, in Hawaii it’s high surf, and Connecticut it’s high wind. The table shows normalised data, fatalities per 1,000,000 people, which highlights the discrepancies in danger between states — for its deadliest event type Mississippi has a fatality rate more than an order of magnitude higher than neighbouring Florida.
Each state’s population is its census population on 1 April 2010 as collected from Wikipedia’s list of US states and territories by population.
# Download the source population file, but only if it
# doesn't already exist in the working directory.
if (!) {
}
# Load the state population data.
state_populations <-
# Create a data frame that contains each state's number of
# fatalities, grouped by event type.
state_fatalities <- storms %>%
%>%
%>%
# Merge the state population and fatalities datasets.
state_data <-
# Calculate per capita rates (see https://xkcd.com/1138/)
# and find out which event type is the biggest killer for
# each state.
per_capita_state_fatalities <- state_data %>%
%>%
%>%
%>%
%>%
%>%
# Print the table.
| State | Event type | Deaths per 1 mill. |
|---|---|---|
| Mississippi | Tornado | 151.7 |
| Arkansas | Tornado | 130.0 |
| Alabama | Tornado | 129.1 |
| Kansas | Tornado | 82.7 |
| Oklahoma | Tornado | 78.9 |
| Missouri | Tornado | 64.8 |
| Tennessee | Tornado | 58.0 |
| Illinois | Heat | 50.9 |
| Alaska | Avalanche | 46.5 |
| Wyoming | Avalanche | 40.8 |
| Indiana | Tornado | 38.9 |
| North Dakota | Tornado | 37.2 |
| Louisiana | Tornado | 33.7 |
| Nebraska | Tornado | 29.6 |
| Kentucky | Tornado | 28.8 |
| Pennsylvania | Excessive Heat | 28.3 |
| Iowa | Tornado | 26.6 |
| Michigan | Tornado | 24.6 |
| South Dakota | Tornado | 22.1 |
| Texas | Tornado | 21.4 |
| Nevada | Heat | 20.0 |
| Minnesota | Tornado | 18.7 |
| Georgia | Tornado | 18.6 |
| Hawaii | High Surf | 17.6 |
| Wisconsin | Tornado | 16.9 |
| Ohio | Tornado | 16.6 |
| Massachusetts | Tornado | 16.5 |
| Utah | Avalanche | 15.9 |
| Maryland | Excessive Heat | 15.2 |
| North Carolina | Tornado | 13.2 |
| West Virginia | Flash Flood | 13.0 |
| South Carolina | Tornado | 12.8 |
| Idaho | Avalanche | 10.2 |
| Arizona | Flash Flood | 9.7 |
| Colorado | Lightning | 9.5 |
| Florida | Rip Current | 9.1 |
| Montana | Lightning | 9.1 |
| Delaware | Excessive Heat | 7.8 |
| New Mexico | Flash Flood | 7.8 |
| Vermont | Flood | 6.4 |
| Washington | Avalanche | 5.2 |
| Oregon | High Wind | 5.0 |
| New York | Excessive Heat | 4.8 |
| New Hampshire | Tstm Wind | 4.6 |
| Maine | Lightning | 4.5 |
| Virginia | Tornado | 4.5 |
| New Jersey | Excessive Heat | 4.4 |
| California | Excessive Heat | 3.0 |
| Rhode Island | Heat | 1.9 |
| Connecticut | High Wind | 1.7 |
Conclusion
Across the United States tornadoes are most harmful to population health, while floods and droughts have the greatest economic consequences, but there is great variation among the states.